From Skeptical to Sold: How We Generated 694 Leads and $324K in Revenue for a Tree Care Company
The Challenge
A small tree care company came to us frustrated with their previous marketing efforts. They had tried various agencies but saw little return. They were spending money without clear tracking, and had no idea which marketing dollars were actually working. They needed proof before committing to a larger investment.
Our Approach
We started with a focused, measurable strategy:
- Google Ads for immediate lead generation and quick wins
- SEO & Local Search for sustainable long-term growth
- Google Local Services Ads for high-intent local customers
- Complete tracking on every single lead source
Every phone call, form submission, and click was tracked. No guesswork. Just data.
The Results
In 2025 (11 months), we generated:
- 694 total leads (225 from Google Ads + 440 from SEO + 29 from 2024)
- 208 converted customers at a 30% close rate
- $324,073 in revenue from digital marketing
- $50,918 total marketing investment
Performance Visualization
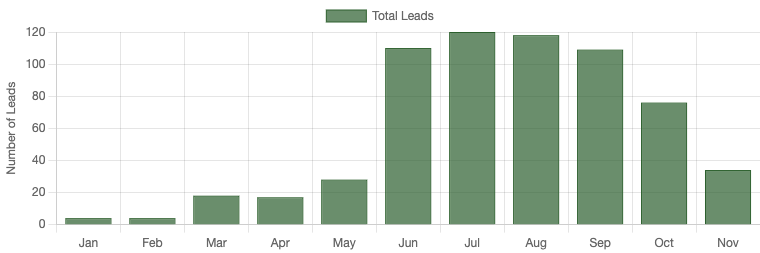
Monthly Lead Generation Growth
Key milestone: June surge to 110 leads when SEO & Google Business Profile optimization kicked in
Peak months: June-September with 110-120 leads per month
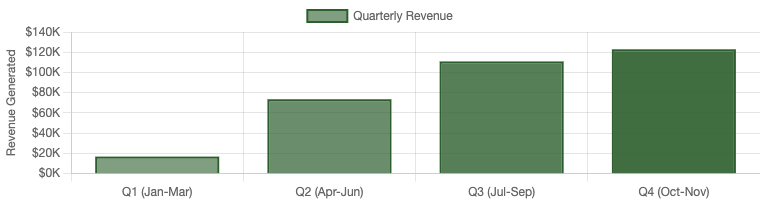
Revenue Growth by Quarter
Q1: $16,800 | Q2: $73,500 | Q3: $110,886 | Q4: $122,887
Demonstrates consistent growth and scalability
Breaking Down the Performance
Google Ads
- Investment: $34,418
- 225 qualified leads
- 74 converted jobs
- $111,626 in revenue
- ROI: 224%
- Cost per conversion: $224
The turning point: After slow Q1, optimization drove ROI above 290% from May onward.
SEO & Organic
- Investment: $16,500
- 440 organic leads
- 148 converted jobs
- $212,447 in revenue
- Peak ROI: 2,457%
- Cost per conversion: $111
Key breakthrough: June surge when Google Business Profile optimization delivered 238 calls.
Local Services Ads
- Investment: $4,962
- 99 charged leads
- 31 converted jobs
- Strong supplement to main campaigns
- $50 per lead average
- Ran August-November only
Added as a test in Q3, performed well for high-intent local searches.
Month-by-Month Growth Story
Q1: Building Foundation (Jan-Mar)
Started slow with 4-18 leads per month. Google Ads finding its footing. SEO groundwork being laid with content and technical optimization.
Total Q1 Leads: 40 | Total Q1 Revenue: $16,800
Q2: Momentum Builds (Apr-Jun)
Google Ads optimization paying off with improved targeting and ad copy. SEO starting to show results with dramatic June surge. Leads jumped from 21 to 110 per month.
Total Q2 Leads: 193 | Total Q2 Revenue: $73,500
Q3: Peak Performance (Jul-Sep)
SEO hit its stride with 80+ leads per month consistently. Google Ads stable and profitable. Local Services Ads added to the mix. This quarter alone generated over $90K in revenue.
Total Q3 Leads: 258 | Total Q3 Revenue: $110,886
Q4: Sustained Success (Oct-Nov)
Maintained 76+ leads per month. All channels performing consistently. Proof that this isn't a flash in the pan - it's a sustainable system.
Total Q4 Leads: 110 | Total Q4 Revenue: $122,887
What Made This Work
1. Complete Visibility
- Tracked 10 missed calls and recovered opportunities
- Identified and filtered spam/hangup calls (estimated 35-42% of some months)
- Monitored every lead source individually
- Real-time optimization based on actual data
2. Multi-Channel Strategy
- Didn't rely on one channel - diversified to reduce risk
- Each platform served a specific purpose in the funnel
- Cross-channel optimization and learning
3. Patience + Persistence
- SEO took 6 months to show major results - we stuck with it
- Continued optimization when early months were slow
- Trusted the data and process, not emotions or hunches
4. Strategic Budget Allocation
- Started Google Ads at $2,414/month to test and learn
- Scaled up to $4,560/month when we validated the channel
- Maintained consistent $1,500/month SEO investment
- Added Local Services Ads when timing and budget allowed
The Numbers Don't Lie
| Metric | Result |
|---|---|
| Total Leads | 694 |
| Total Investment | $50,918 |
| Total Revenue | $324,073 |
| Net Profit Impact | $273,155 |
| Overall ROI | 536% |
| Cost Per Lead | $73 |
| Cost Per Conversion | $245 |
The Transformation
Before Working With Us
- No clear tracking or visibility
- Wasting money on ineffective marketing
- No idea what was actually working
- Frustrated with previous agencies
- Skeptical about digital marketing ROI
After 11 Months
- Crystal-clear visibility on every dollar spent
- Predictable lead flow (76+ leads/month consistently)
- Data to make smart budget decisions
- ROI that speaks for itself
- Confidence in their marketing investment
The Bottom Line
For every $1 invested in marketing, we generated $6.36 in revenue.
This wasn't luck. This was systematic tracking, strategic optimization, and patience to let SEO mature while maintaining profitable paid campaigns.
Most importantly? The client now has a predictable growth engine that generates qualified leads every single day.
What This Means for Your Business
The tree care industry is competitive, but the numbers prove that with the right strategy and execution, growth is not just possible - it's measurable and repeatable.
The question isn't whether digital marketing works.
The question is: Are you tracking it properly and giving it time to work?